Square meters and the rate.
I've built an open dashboard on how people in Russia's largest regions take out mortgages on new-build apartments — month by month, against the key rate, the dollar exchange rate and subsidized-mortgage decisions. DOM.RF and Bank of Russia data since 2019, 19 regions, updated monthly.
Why it exists
The new-build market gets talked about a lot, but the numbers are rarely shown side by side. Here, on a single timeline, are primary-market mortgage issuance, the key rate and the dollar, with mortgage-policy decisions marked on top: the launch of subsidized mortgages, central bank hikes, the mortgage standard. You can see what happened after each decision.
It's built primarily for journalists and analysts: a ready-made paragraph with numbers for the selected region, automatic “facts of the month”, a regional ranking, and buttons that copy a table into Excel or a chart as an image. Feel free to cite it — the source line is ready too.

What the August 2026 data shows
- The worst August in seven years of observations. Even the dismal August 2024, the first after mass subsidized mortgages ended, was slightly higher.
- Year to date — almost level with last year. January–August saw 234K loans, 0.9% fewer than a year earlier: recent declines ate the spring growth.
- The rate gap speaks for itself. With a 14% key rate, market-rate mortgages are barely affordable, so an average of 7.3% means new-build lending rests on subsidized programs.
- The rate works with a delay. In year-on-year terms, Russia-wide issuance tracks the key rate most closely with a lag of about three months. That's correlation, not proof of cause.
Regions: all down, but differently
In August all 19 regions in the dashboard were below last year. The mildest declines were in Krasnoyarsk (−13%), Perm (−14%) and St. Petersburg (−17%). Tyumen fell the most (−44%), along with Krasnodar — exactly half of August 2025. Moscow: −24%, with a contract price of 441K ₽ per m².

Construction and deals: what is sold before completion
Mortgages show only part of all purchases, so the dashboard now adds two more views of the market: from the construction side and from registered deals.
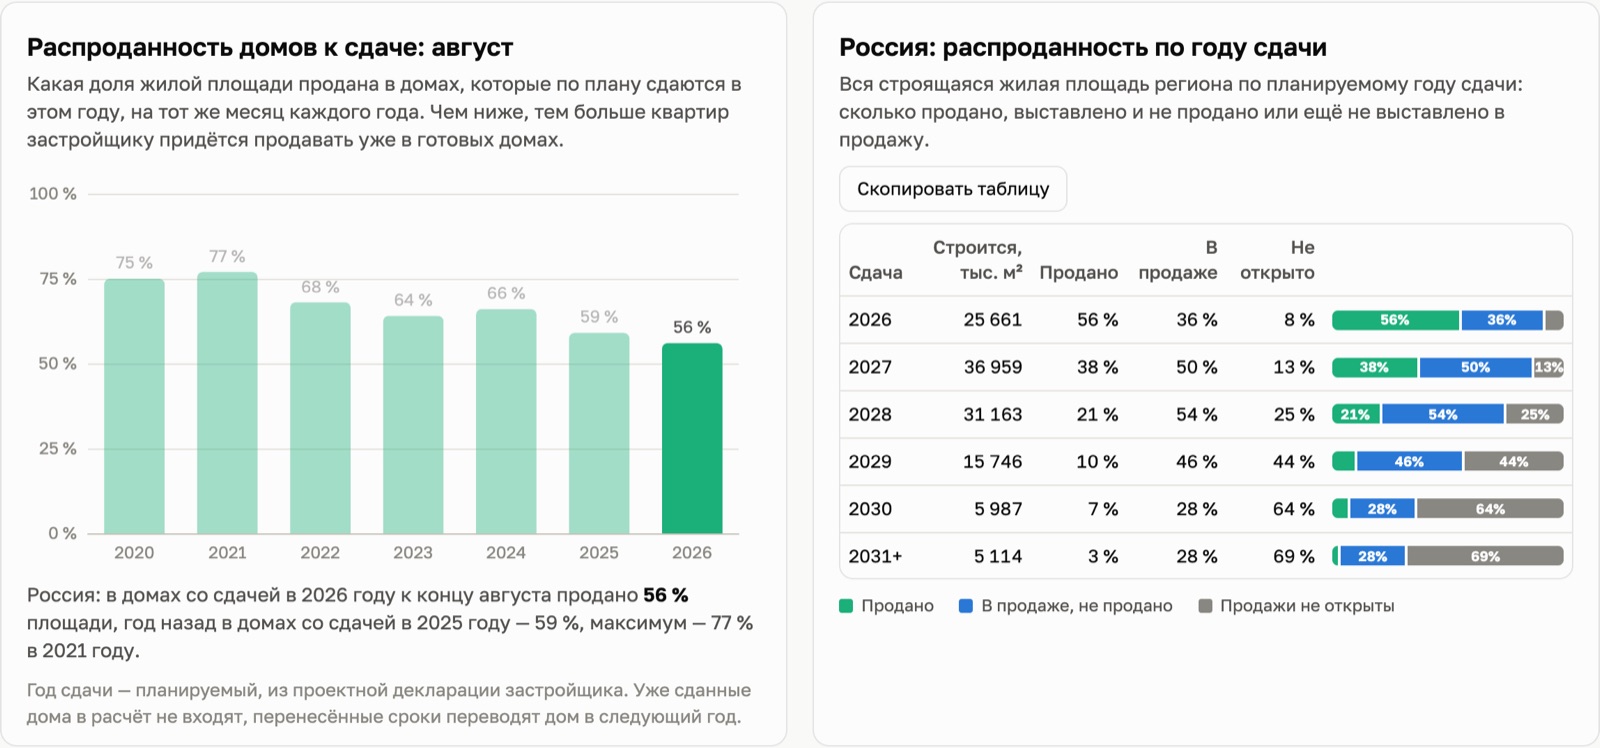
- Buildings are completed less and less sold. By August, buildings due that year were 75–77% sold in 2020–2021, 64–68% in 2022–2024 and 56% now. Developers will have to sell the rest in finished buildings.
- Regions diverge again. In Moscow, buildings due in 2026 are 73% sold; in Krasnodar, 36%; in Chelyabinsk, 35%.
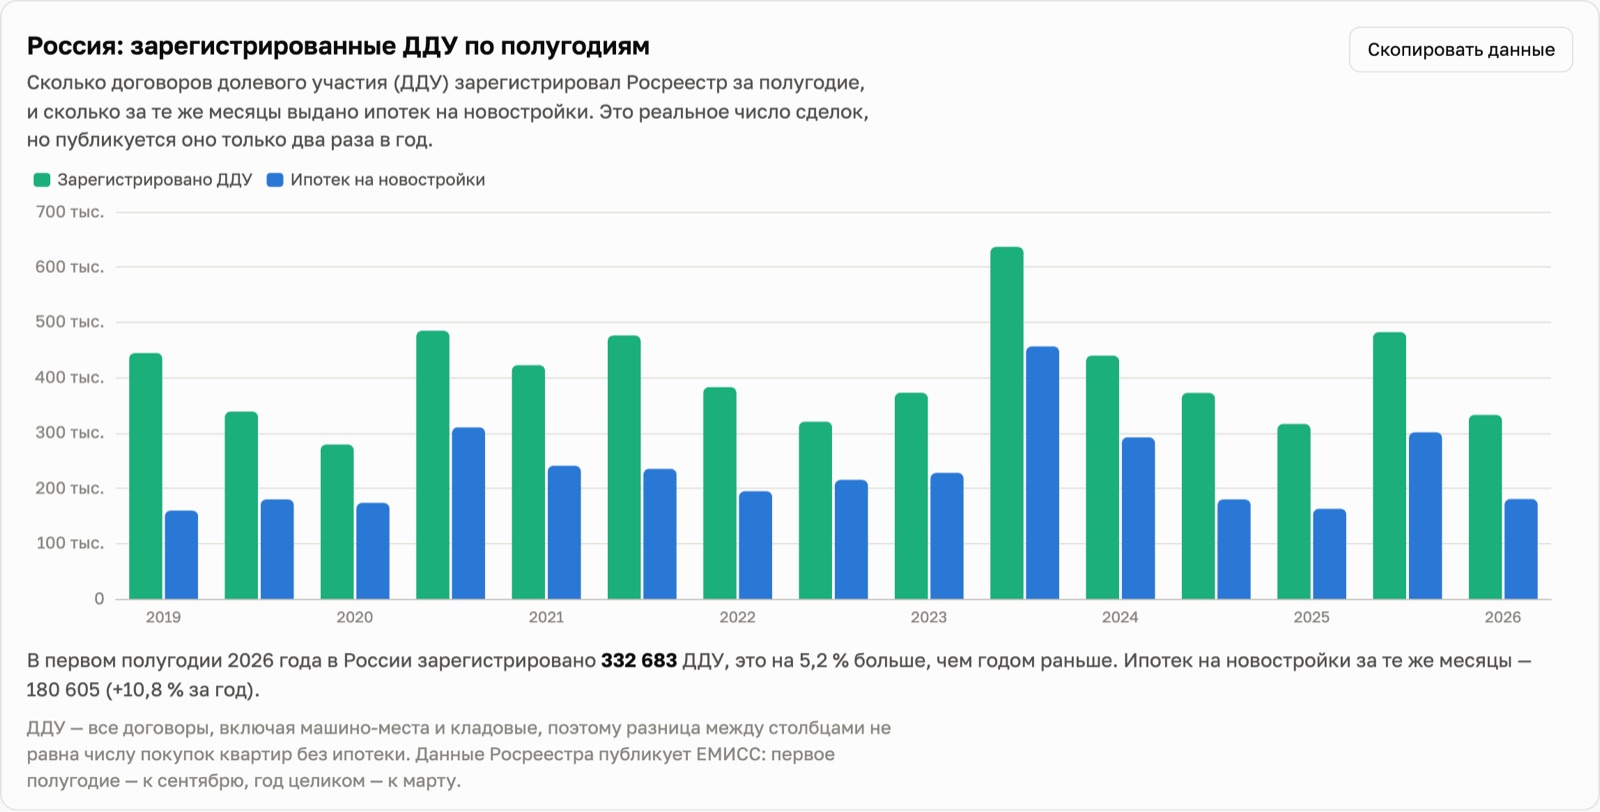
- There are more deals than mortgages, and the gap shifts. Across Russia, DDU registrations rose 5% over the half-year and new-build mortgages 11%. In Moscow, DDU fell 30% while mortgages fell only 5%.

How to read these numbers honestly
- Mortgage issuance isn't sales. Some apartments are bought with cash or developer installment plans, whose share grew in 2024–2026. So the correct phrasing is “new-build mortgages”, not “sales”.
- Serviced apartments aren't included in equity-contract statistics — a noticeable part of the Moscow market.
- Completion years are planned, and DDU isn't only apartments. Sell-out uses the deadline from the project declaration; completed buildings drop out. DDU counts include parking spaces and storage rooms, so “DDU minus mortgages” is not the number of purchases without a loan.
- Recent months get revised. The portal adjusts data retroactively, so each update re-downloads the last two months.
Updates
The data is updated monthly, when DOM.RF publishes a new month. Next up: September 2026. If you're a journalist and need a region that isn't listed, or a specific cut of the data — get in touch.